
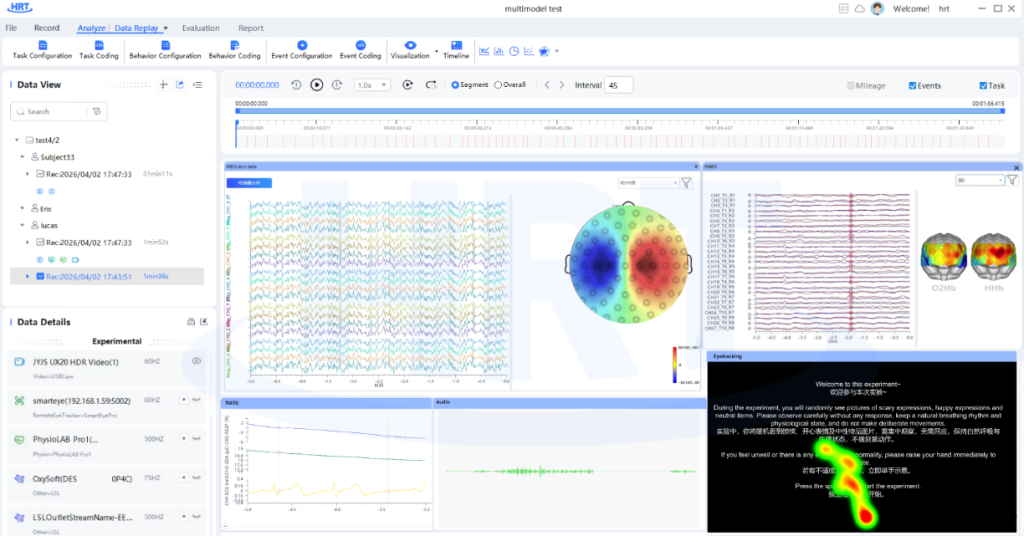
When we see an image, hear a sound, or complete a complex cognitive task, the brain is undergoing a series of rapid and complex neural activities.
How do these activities occur? When does the brain generate a response? Which brain regions are involved in this process? How are different neural activities related to our visual behavior and physiological changes?
Magnetoencephalography (MEG) is a technology used to capture such brain magnetic signals, providing an important research tool for exploring these questions. Researchers record the “magnetic traces” left by brain activity through highly sensitive superconducting sensors placed outside the head.
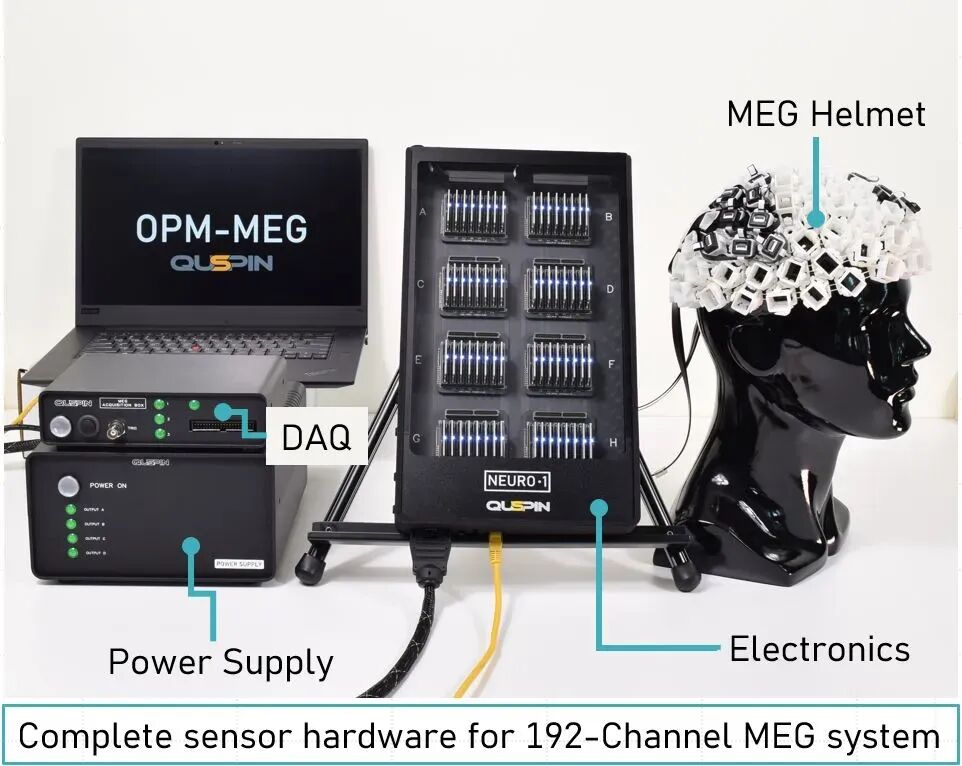
In terms of temporal resolution, MEG and electroencephalography (EEG) both have millisecond-level advantages, helping researchers capture occurring neural response processes. Therefore, they are often used to study the dynamic mechanisms of brain information processing in processes such as perception, attention, language, and memory.
Why Use Magnetoencephalography (MEG)?
Millisecond-level neural dynamics, millimeter-level brain source localization
The brain’s perception, attention, memory, and decision-making do not occur statically, but rather involve dynamic processes across multiple time scales.
For example, when a subject sees a visual stimulus, researchers may want to understand:
●After the stimulus is presented, when does the brain begin to generate a neural response?
●Under different experimental conditions, what are the differences in the temporal changes of brain magnetic signals?
●What neural activity characteristics are reflected by different frequency components?
●Which brain regions might the observed brain magnetic responses come from?
MEG can record changes in neural activity from the temporal dimension and, combined with analytical methods, further explore their spatial sources, providing important information for understanding brain function.
The guidelines in Nature Protocols also specifically compare the spatiotemporal resolution of common neuroimaging modalities, intuitively demonstrating the advantages of MEG: it can precisely localize the brain regions of neural activity (millimeter-level) while also capturing rapid millisecond-level neural dynamic changes in the brain—a characteristic that is key to studying rapid neurocognitive processes such as perception, cognition, and emotion.
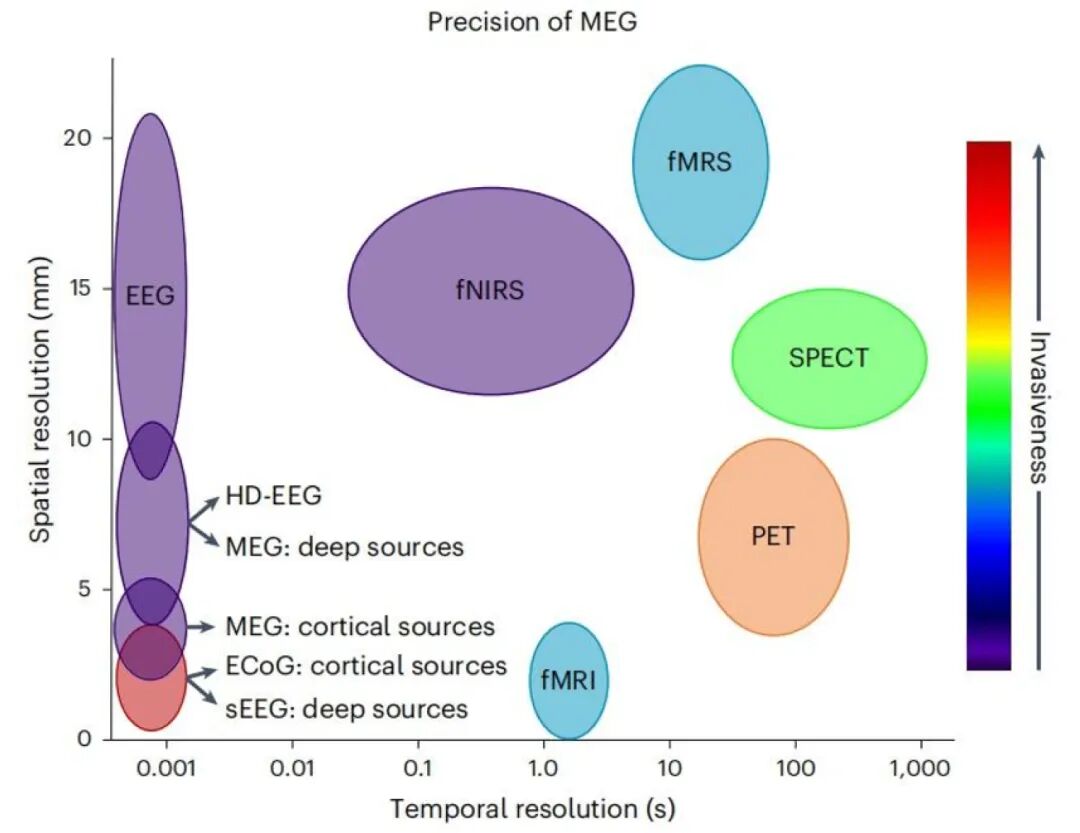
Figure 1. Comparison of spatial and temporal resolution of common neuroimaging modalities. Source: Bell et al. (2026), Nature Protocols
Typical Application Scenarios of MEG
Cognitive Neuroscience
Study neural activity during cognitive processes such as perception, attention, memory, language, learning, and decision-making.
Visual and Auditory Research
Analyze the brain’s rapid responses to external information around visual, auditory, and other stimulus events.
Brain-Computer Interface(BCI) and Neural Engineering
Explore neural signal features to provide data analysis support for brain-computer interaction and neural engineering-related research.
Human Factors and Cognitive Load Research
Combine experimental tasks, behavioral performance, and other physiological data to explore the relationship between cognitive activity and human behavior.
Neuroscience and Clinical Research
Use brain magnetic signals and related analytical methods to conduct research in directions such as neural function, brain activity, and brain networks.
HRT MEG Solution: From Data Import to Multimodal Research
HRT (Human Research Tool) has integrated MEG data import and analysis capabilities, further expanding the data processing and analysis workflow for neuroscience research. It helps researchers start from brain magnetic signals, explore the temporal characteristics and spatial sources of neural activity, and connect experimental data from more modalities.
Researchers can incorporate MEG data into the HRT platform and, combined with existing capabilities in experiment management, data organization, and multimodal analysis, conduct multidimensional analysis of brain magnetic signals.
MEG Data Import → Data Analysis → Source Localization → Multimodal Research
HRT is committed to integrating MEG data analysis into a more complete experimental research workflow, helping researchers move from raw signal observation to deeper exploration of neural activity.
From Time to Space: Multidimensional Exploration of MEG Activity
01 Time-domain Analysis
※Observe the dynamic changes of brain magnetic signals over time.
Time-domain analysis is used to observe the temporal change characteristics of MEG signals.
Through multi-channel signal display and time window analysis, researchers can observe the brain magnetic waveforms recorded by different sensors and explore the dynamic changes in neural activity.
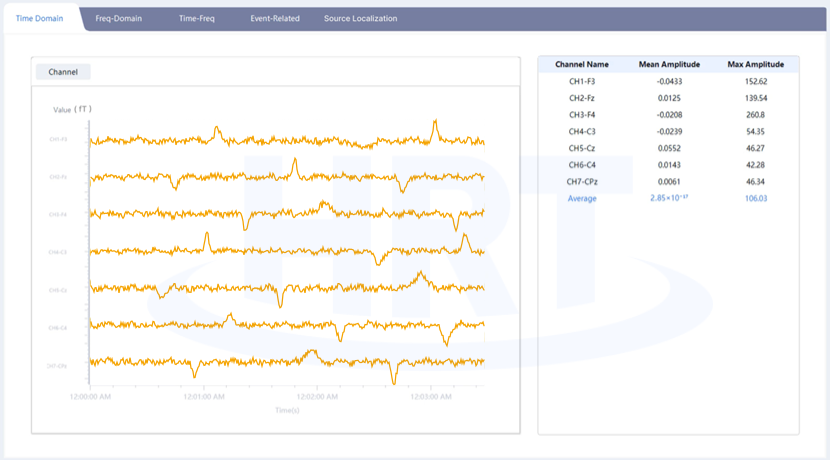
Core value: Observe the change process of brain magnetic signals from the temporal dimension.
02 Frequency-domain Analysis
※Explore the frequency characteristics of brain magnetic signals.
Frequency-domain analysis converts brain magnetic signals from the temporal dimension to the frequency dimension, helping researchers observe different frequency components and spectral features.
Through frequency-related analysis, researchers can further explore frequency changes in brain magnetic signals under different experimental conditions, providing another analytical perspective for neural activity research.
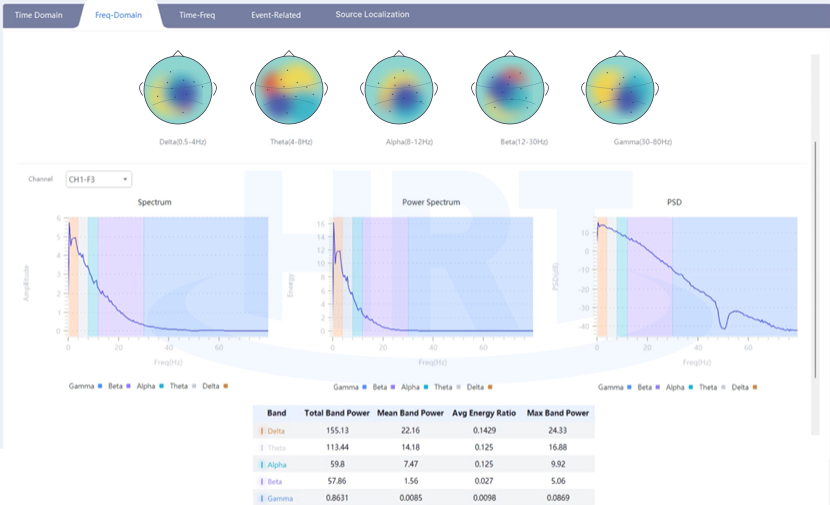
Core value: Explore the characteristics of brain magnetic signals from the frequency dimension.
03 Time-Frequency Analysis
※Simultaneously observe temporal and frequency changes in neural activity.
The frequency characteristics of brain magnetic signals may change over time. Time-frequency analysis combines the two dimensions of time and frequency, helping researchers observe frequency changes in neural activity at different time stages.
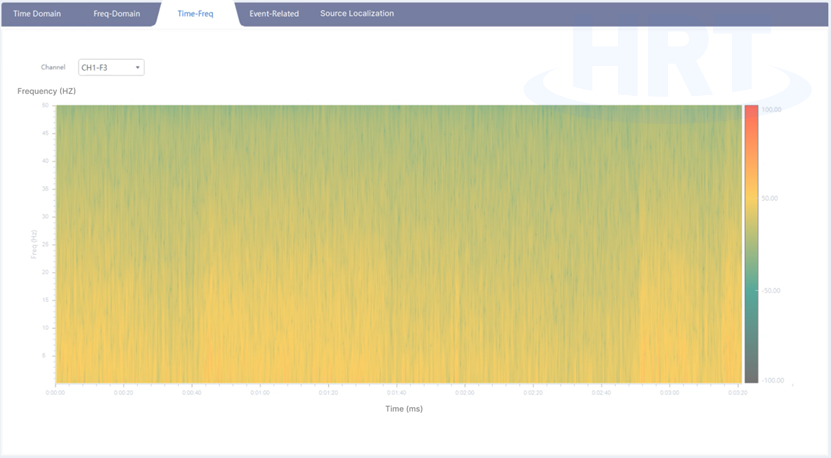
Core value: Explore the dynamic time-frequency characteristics of neural activity.
04 Event-related Analysis
※Observe brain magnetic responses around experimental events.
In visual, auditory, cognitive, and other experiments, researchers usually need to focus on brain magnetic responses before and after stimulus presentation or task events.
HRT supports event-based analysis, helping researchers observe changes in brain magnetic signals around specific time windows.
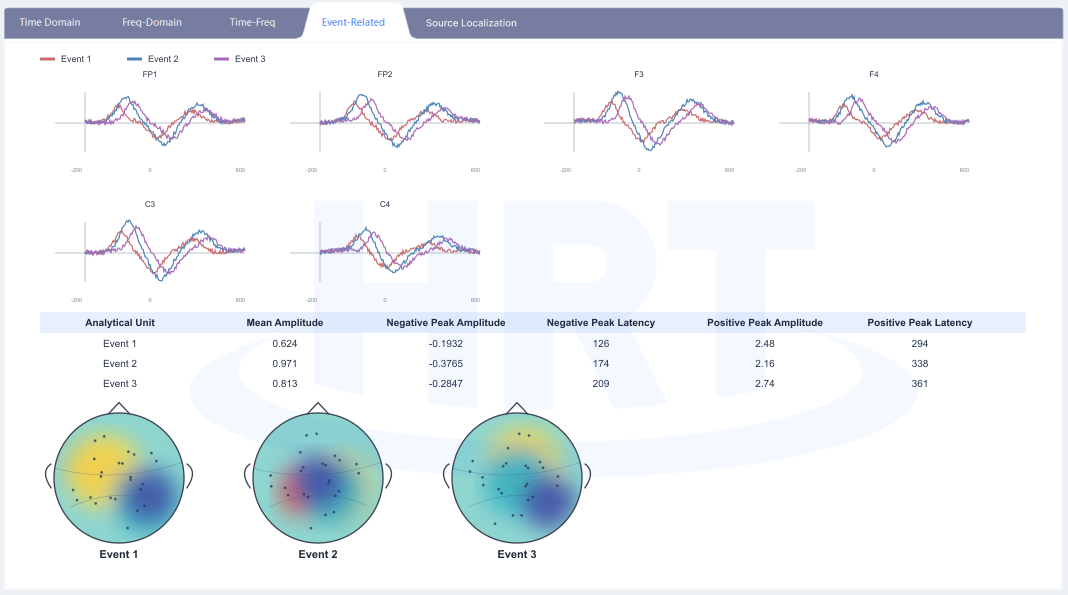
Core value: Establish temporal associations between brain magnetic signals and experimental stimuli or task events.
05 Source Localization Analysis
※Exploring the Spatial Origin of Brain Activity
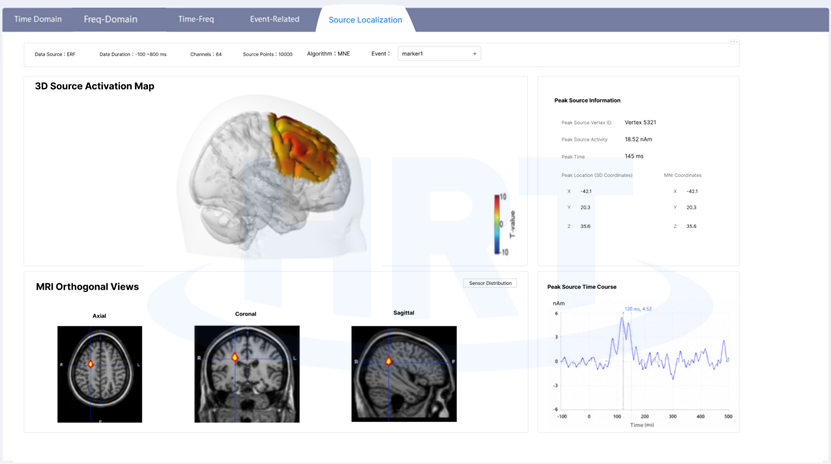
From Sensor Signals to Brain Source Space
MEG sensors record brain magnetic signals. In addition to observing temporal changes in signals, researchers also want to further understand:
Which locations in the brain might these neural activities come from?
Source localization analysis uses computational models to map sensor-level signals to brain source space and combines anatomical information such as MRI for result display, providing an analytical means for exploring the spatial origin of neural activity.
HRT has integrated MEG source localization analysis capabilities, supporting event-related data as a starting point and combining multidimensional results such as 3D brain source activation, MRI three-view, peak information, and source activity curves to observe the spatial distribution and dynamic changes of brain activity.
3D Brain Source Activation
Display source localization results through a 3D brain surface model, mapping source activity intensity onto the brain surface to intuitively present the spatial distribution of brain activity.
MRI Three-View Localization
Combined with MRI data, simultaneously display source localization results in the axial, coronal, and sagittal directions. Through multi-planar views, assist researchers in examining the location of source activity in the anatomical space of the brain.
Peak Information and Source Activity Curves
For source localization results, the HRT interface displays peak source point information, including peak time, activity intensity, and spatial coordinates. At the same time, source activity curves are used to observe activity changes at specified source points within the analysis time window.
Multimodal Fusion: Connecting Brain Activity, Cerebral Blood Oxygen, and Visual Behavior
There are complex relationships between the brain’s neural activity, human behavior, and physiological changes. A single modality can provide information from a specific dimension, while multimodal research provides a richer perspective for observing the relationships between these dimensions.
Because MEG has fine temporal resolution, researchers also use fMRI in combination with MEG, matching the obtained MEG signals with brain structures obtained from fMRI for analysis. HRT, as a multimodal human factors and brain science research platform, supports incorporating MEG, functional near-infrared spectroscopy (fNIRS), desktop eye tracking, and other data into a unified experimental environment, and conducting data association and analysis by combining timelines and event information.
MEG × fNIRS: Neural Electromagnetic Activity × Cerebral Blood Oxygen Changes
MEG provides rapid neural activity information, while fNIRS provides cerebral blood oxygen dynamics information.
Combining the two modalities can be used to explore the relationship between neural activity and blood oxygen changes, providing a data foundation for multimodal brain function research.
MEG × Eye Tracking: Brain Activity × Visual Behavior
Eye tracking data records the subject’s fixation position, fixation duration, and visual behavior characteristics; MEG records the brain magnetic responses during the corresponding experimental process.
Combining the two can be used for research in directions such as visual attention, reading, visual cognition, and human-computer interaction.
Multidimensional Association Under a Unified Timeline
In visual attention and cognition research, researchers may simultaneously focus on:
●Where is the subject looking, and for how long?
●After stimulus presentation, when does the brain generate a response?
●How does blood oxygen change in the relevant brain regions?
Through the HRT platform, MEG, fNIRS, Eye Tracking, and experimental event data can be viewed and associated under a unified timeline, helping researchers build a more complete experimental analysis perspective.
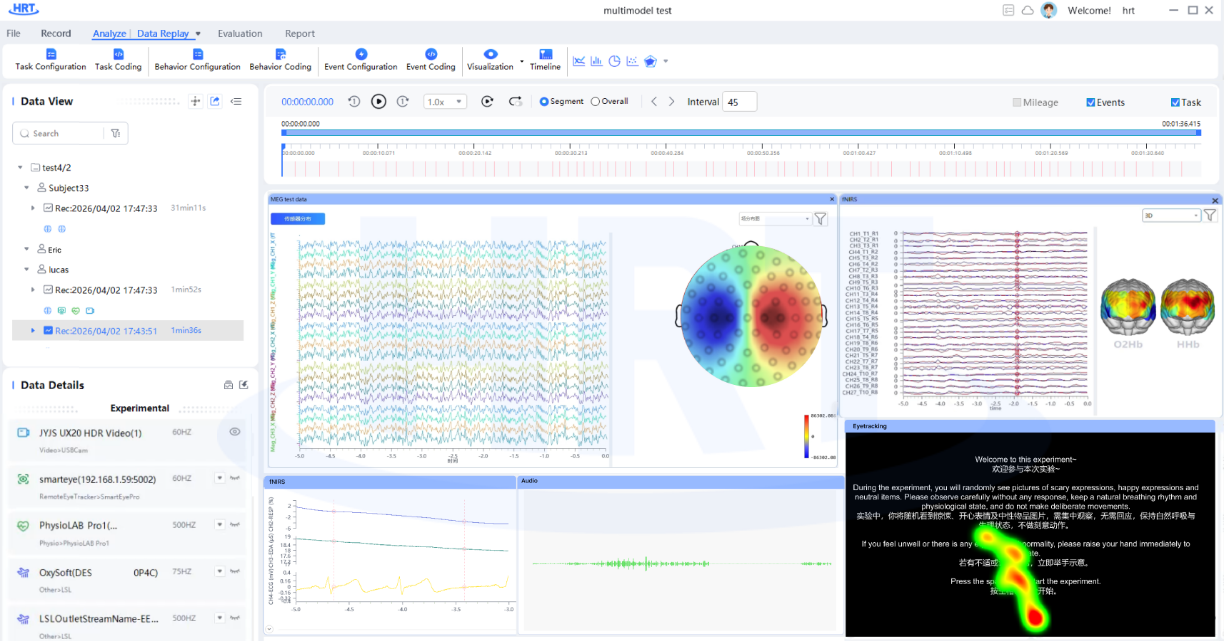
HRT × MEG: Summary of Core Capabilities and Research Value
With the integration of MEG data import and analysis capabilities, HRT has further expanded its data processing and analysis capabilities for neuroscience research.
From temporal changes in brain magnetic signals, to event-related responses, to source localization and spatial presentation of brain activity; from single MEG data to association analysis of multimodal data such as MEG & fNIRS & Eye Tracking, HRT is committed to helping researchers build a more complete research workflow.
Core Capabilities
●MEG Data Import
Incorporate brain magnetic data into the HRT platform for management and analysis.
●Multidimensional MEG Analysis
Time-domain, frequency-domain, time-frequency, event-related analysis, and source localization.
●Spatial Visualization of Brain Activity
3D brain source activation, MRI three-view, and dynamic display of source activity.
●Multimodal Data Association
Connect MEG, fNIRS, Eye Tracking, and experimental event data.
HRT will continue to expand its data access, analysis, and fusion capabilities in the fields of neuroscience and human factors research, providing researchers with a more flexible and complete experimental and analytical platform!